Math the final frontier. OK here is a “try this at home” experiment. Draw a triangle in a piece of paper. Now make a random dot anywhere on that page. Now from that point you’ll go half way to a vertex (one of the points). To figure which vertex to head towards let’s choose a random direction- roll a six sided die, if it lands on 1 or 2 go to the “bottom left” point, if it lands on a 3 or 4 go to the top, and if it lands on a 5 or 6 go to the bottom right point.

Now do a few dozen rolls each time going from halfway from the previous point you made to the direction- you will see a bit of an outline forming. In fact, if you do a few thousand iterations you will begin to notice that you’ll see the triangle filling in. When you look at it you’ll see a very strange effect- there will be gaps where no points end up. What is really weird is if you zoom into one of the triangles that make up the big one it’ll be an exact version of the one you started with and you can actually zoom into it and keep zooming forever. It is weird.
What you are seeing is an example of Sierpinski Triangle, which is the name of the shape. This whole mathematical system evolves regardless of your starting conditions of what point you start with and which vertices you move towards. This is called an “Attractor” and it is the first of a series of interesting mathematical models. There are more forms of attractors which lead to “Strange Attractors” which lead to “Fractals” which I’ll likely play around with soon.
I watched a YouTube video on the math behind it and I just had to try to see it in action myself, so I wrote a program in Python (a popular programming language). I potted 15,000 plots after giving it a single starting point. Each direction to go in was chosen randomly by the computer, now if I use smaller plot points, you will see a bit more detail, but I like the gumball look it has personally.
Here is what I ended up when I ran my own program, this example has those 15,000 points plotted:
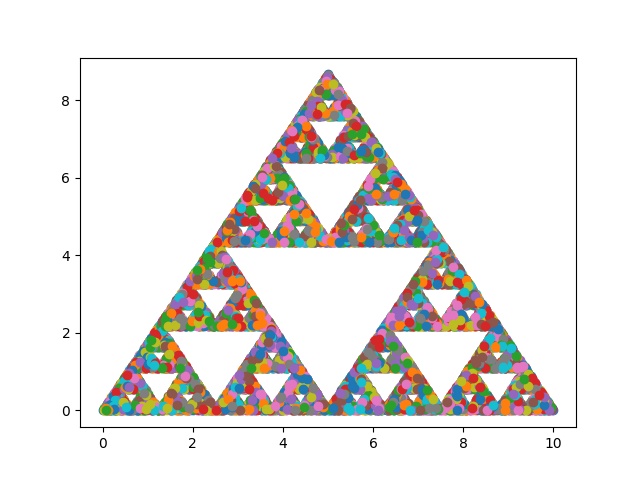
The general algorithm is this:
-Ask for a starting X and Y coordinate.
-Identify first ‘plot points’- the three vertices of the triangle and the user entered point
-Print confirmation of the points and start graphing.
-Choose a random direction (vertex one, two or three) and go halfway to it and plot it
-Repeat this for as often as you like (in my actual code below it states 100 iterations but you can adjust)
-Plot each point
Now what you will end up seeing is pretty much the same thing I plotted above, you’ll be plotting it point by point so what you’ll see is the actual data showing up. It was a fun project for a few hours and let me get back to Python a bit which is a super easy to pick up programming language. If you want to download the code for yourself please check out my GIthub link for this project here https://github.com/ericcrichardson/PythonFun
#python #math #science #technology #programming #Statisitcs
Ericcrichardson@gmail.com
